
Discount Analytics
The Analytics tab answers one question: which of my discounts are worth running? Instead of guessing whether a promotion worked, you see every discount ranked by return — and can drill into any one of them.
Every view here is free — there is no analytics feature behind a paid tier.
Headline stats
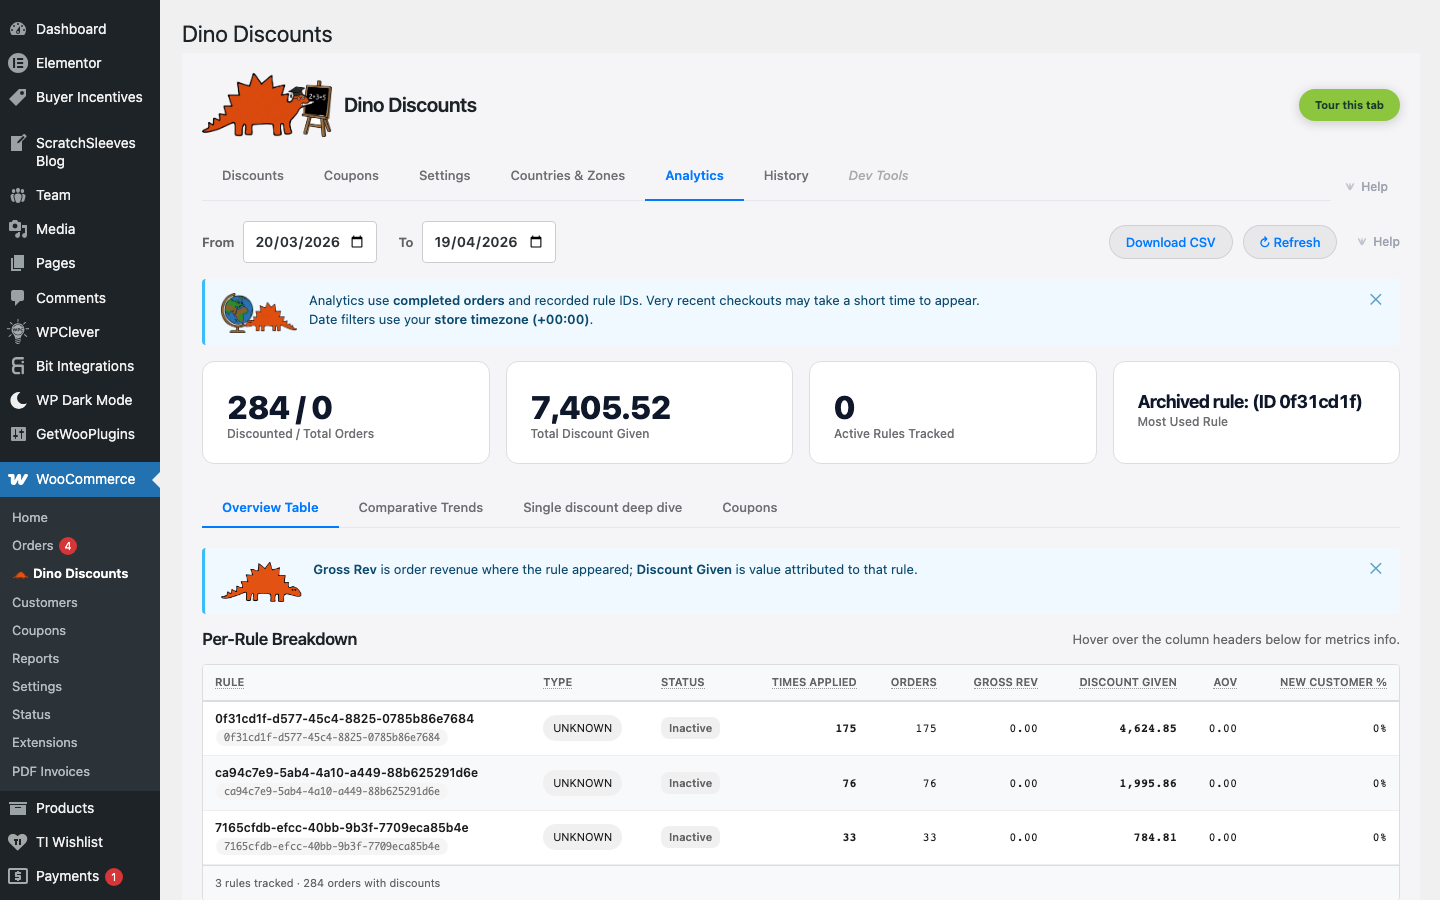
Section titled “Headline stats”The top of the page shows four stat cards at a glance:
| Stat | What it measures | |------|-----------------| | Discounted / Total Orders | How many orders applied at least one discount, against the total order count in range | | Total Discount Given | The summed discount value delivered to customers over the period (broken down per currency in a multi-currency store) | | Active Discounts Tracked | How many rules accrued usage in the date range | | Most Used Discount | The single rule that fired most often (only shown when there's data) |
The stat cards update as you change the date range — they're scoped to the From / To pickers at the top of the page.
Five views
Section titled “Five views”The Analytics tab has five sub-tabs, each scoped to the same date range and currency:
Summary
Section titled “Summary”The default view — and the heart of the tab. It puts every discount in one ranked table, best-to-worst by ROI, above a chart that plots how deep each discount cuts against what it returns.
The depth-vs-ROI chart places one dot per discount on shared axes: the effective discount depth (how much of order value you gave away, across the bottom) against its ROI (revenue returned per £1 given, up the side). Dot size reflects order volume; the best performer is flagged green and the worst red. At a glance you see which discounts return the most for the least.
The ranked table lists every rule that fired in range, sorted best-to-worst by ROI, with these columns:
| Column | What it tells you |
|--------|------------------|
| Discount | The rule name, its type pill (e.g. Min Spend % Off, Buy X Get Y), and whether it's currently active |
| Orders | Orders that included this discount |
| Gross Rev | Total value of those orders |
| Discount Given | Total discount value handed to shoppers — your cost |
| AOV | Average order value for those orders (gross rev ÷ orders) |
| New Cust. % | Share of redemptions from first-time customers |
| ROI | gross rev ÷ discount given — £ back per £1 given. The table is ranked on this column; the best and worst are flagged. |
A scope bar above the table lets you switch what the view covers:
- All discounts (default) — the full ranked list.
- One discount — a single-discount read: a plain-English verdict, the explained numbers, and a small redemptions-over-time chart (see the deep dive below).
- Compare — pick a subset and re-rank just those against each other.
Comparative Trends
Section titled “Comparative Trends”Time-series charts for cross-discount comparison. Pick two or more rules and overlay their redemption / discount-given curves over the date range, with a metric selector (Orders / Gross Revenue / Discount Given / AOV) and a daily breakdown table. Useful for A/B comparisons between two recipes targeting the same audience.
Single discount deep dive
Section titled “Single discount deep dive”The full read on one rule: a factual verdict sentence, the explained numbers (revenue driven, redemptions, discount given, ROI, new-customer split — plus Margin ROI when costs are set), and a redemptions-over-time spark chart. When a rule has a total usage limit, a Go deeper panel forecasts when it will run out at the current pace.
Timing
Section titled “Timing”When redemptions happen: a day-of-week profile of when your discounts get used, and a velocity reading of how quickly a discount ramps after it goes live. Timing counts redemptions, not revenue — it answers when, so you can schedule around your real demand.
Coupons
Section titled “Coupons”Coupon-specific stats — code redemption rates, bulk-pool usage (codes redeemed vs. codes issued), and per-coupon attribution. This view reads coupon activity captured at checkout, so a pooled-code coupon reports against the coupon rather than the underlying rule.
Multi-currency
Section titled “Multi-currency”In a multi-currency store, each rule reports per currency — the Discount Given, Gross Rev, and AOV figures honour the order's checkout currency, so per-currency totals never blend with FX'd values. The headline Total Discount Given card shows a per-currency breakdown, and the depth-vs-ROI chart plots each rule once per currency it was used in.
This means the Analytics tab never reports cross-currency totals from FX conversions — only natively-recorded values per checkout currency. See Multi-currency for the per-currency model.
Date-range filtering
Section titled “Date-range filtering”Filter by time period to:
- Compare promotional periods — did your Black Friday tiered discount outperform last year's flat one?
- Measure promotion impact — filter to the exact dates a promotion ran
- Track trends — is usage growing over time?
The default range is the last 30 days; pick any custom window using the From / To date inputs. Date filters use your store timezone, and very recent checkouts may take a short time to appear.
Deleting all analytics data
Section titled “Deleting all analytics data”The Analytics tab has a Delete all data button for clearing your entire reporting history — useful after testing, when handing a store over, or to start a fresh measurement period.
It is deliberately hard to fire by accident:
- Click Delete all data to open the Delete all analytics data? dialog.
- The dialog warns that this permanently removes every recorded analytics event — your entire discount and coupon reporting history — and that it cannot be undone.
- The confirm button stays disabled until you type the word
DELETE(exactly — uppercase, no extra spaces) into the field. - Only then does Delete all data unlock.
Independent of the cart hot path
Section titled “Independent of the cart hot path”Analytics data is captured at checkout time — each order is tagged with its discount rule IDs, and those events are summarised into a dedicated analytics-events table that the Analytics tab queries lazily. The dashboard does not add overhead to the rule-evaluation hot path that runs on every cart; opening the Analytics tab queries the events table directly, not the live engine.
This separation is why analytics queries can be heavy without affecting checkout performance. See Performance Monitoring for the hot-path budget.
Using analytics to optimise
Section titled “Using analytics to optimise”Back the winners, cut the losers
Section titled “Back the winners, cut the losers”The Summary ranking does this for you: the discounts flagged best return the most revenue per £1 given — consider giving them more prominence or budget. The one flagged worst is giving away the most for the least back — a candidate to tighten, re-target, or retire. The depth-vs-ROI chart makes the trade-off visual: a deep discount is only worth it if it sits high on the ROI axis.
Find underperforming discounts
Section titled “Find underperforming discounts”If a discount has very few Orders, consider:
- Lowering the qualification threshold
- Turning on the Spend-more nudge in the Messaging section to guide customers toward it
- Improving the product-page display so shoppers know the deal exists
Adjust tiers
Section titled “Adjust tiers”If most customers hit your lowest tier but few reach higher ones, consider:
- Narrowing the gap between tiers
- Tightening the next-tier nudge ("Spend [amount_left] more for [next_tier]")
- Testing a higher first-tier discount with a lower threshold
What's next
Section titled “What's next”- Performance Monitoring — the cart-eval hot-path budget
- Cart Labels — what the customer sees in the cart
- Upsell Messages — nudges that lift the redemption count